Application of data analysis culture in the UX team

Timeline
12 months
Client
Gruvi
Industry
Prop-Tech
Role
Staff Designer
Responsibilities
Create the event request process
Promote data usage in the company
Define KPIs with stakeholders
Create data views in Mixpanel
Mentor UX designers
Analyse UX opportunities and insights
Overview
Gruvi’s introduction as Superlogica’s first data-centric solution for housing management, emphasizing my leadership in its UX implementation
Challenges
Clarify business goals
Work with quantitative data
Implement a new design process
Define key business and UX indicators
Encourage all designers to use data
Implement data in the UX team
Role
Staff Designer
Timeline
12 months
Client
Superlógica
Industry
Prop-Tech
Responsabilities
Create the event request process
Promote data usage in the company
Define KPIs with stakeholders
Create data views in Mixpanel
Mentor UX designers
Analyse UX opportunities and insights
Overview
Gruvi’s introduction as Superlogica’s first data-centric solution for housing management, emphasizing my leadership in its UX implementation
Challenges
Clarify business goals
Work with quantitative data
Implement a new design process
Define key business and UX indicators
Encourage all designers to use data
Implement data in the UX team
Application of data analysis culture in the UX team

Timeline
12 months
Client
Gruvi
Industry
Prop-Tech
Role
Staff Designer
Responsibilities
Create the event request process
Promote data usage in the company
Define KPIs with stakeholders
Create data views in Mixpanel
Mentor UX designers
Analyse UX opportunities and insights
Overview
Gruvi’s introduction as Superlogica’s first data-centric solution for housing management, emphasizing my leadership in its UX implementation
Challenges
Clarify business goals
Work with quantitative data
Implement a new design process
Define key business and UX indicators
Encourage all designers to use data
Implement data in the UX team
Role
Staff Designer
Timeline
12 months
Client
Superlógica
Industry
Prop-Tech
Responsabilities
Create the event request process
Promote data usage in the company
Define KPIs with stakeholders
Create data views in Mixpanel
Mentor UX designers
Analyse UX opportunities and insights
Overview
Gruvi’s introduction as Superlogica’s first data-centric solution for housing management, emphasizing my leadership in its UX implementation
Challenges
Clarify business goals
Work with quantitative data
Implement a new design process
Define key business and UX indicators
Encourage all designers to use data
Implement data in the UX team
Application of data analysis culture in the UX team

Timeline
12 months
Client
Gruvi
Industry
Prop-Tech
Role
Staff Designer
Responsibilities
Create the event request process
Promote data usage in the company
Define KPIs with stakeholders
Create data views in Mixpanel
Mentor UX designers
Analyse UX opportunities and insights
Overview
Gruvi’s introduction as Superlogica’s first data-centric solution for housing management, emphasizing my leadership in its UX implementation
Challenges
Clarify business goals
Work with quantitative data
Implement a new design process
Define key business and UX indicators
Encourage all designers to use data
Implement data in the UX team
Role
Staff Designer
Timeline
12 months
Client
Superlógica
Industry
Prop-Tech
Responsibilities
Create the event request process
Promote data usage in the company
Define KPIs with stakeholders
Create data views in Mixpanel
Mentor UX designers
Analyse UX opportunities and insights
Overview
Gruvi’s introduction as Superlogica’s first data-centric solution for housing management, emphasizing my leadership in its UX implementation
Challenges
Clarify business goals
Work with quantitative data
Implement a new design process
Define key business and UX indicators
Encourage all designers to use data
Implement data in the UX team


From designing experience to measuring experience
From designing experience to measuring experience
Superlogica didn't have data metrics as a strong point in its legacy within the housing sector's product teams.
Gruvi was the company's first product to take on this challenge since its inception, and I ended up taking on the role of leading the data implementation in the UX team, a task I continue to execute to this day.
Primary goals
Primary goals
Achieve 100% of key indicators metricized within 3 months
100% of Gruvi UX team requesting events within 1 year
Monthly KPI analysis report for strategic features and their opportunities
Impact
Impact
Montly reports in 2 years
Montly reports in 2 years
%
%
KPIs metricized
KPIs metricized


%
%
Support from executives
Support from executives
/
/
Team members using data
Team members using data
Applied strategies
Applied strategies
Primary goals
Achieve 100% of key indicators metricized within 3 months
100% of Gruvi UX team requesting events within 1 year
Monthly KPI analysis report for strategic features and their opportunities
How were the business KPIs defined?
How were the business KPIs defined?
In this stage, alignment with directors, coordinators, and managers from various areas of the analyzed product was of utmost importance. It was crucial to identify the critical areas impacting business objectives.
We also conducted a benchmark analysis of the KPIs used by competitors or similar sectors.
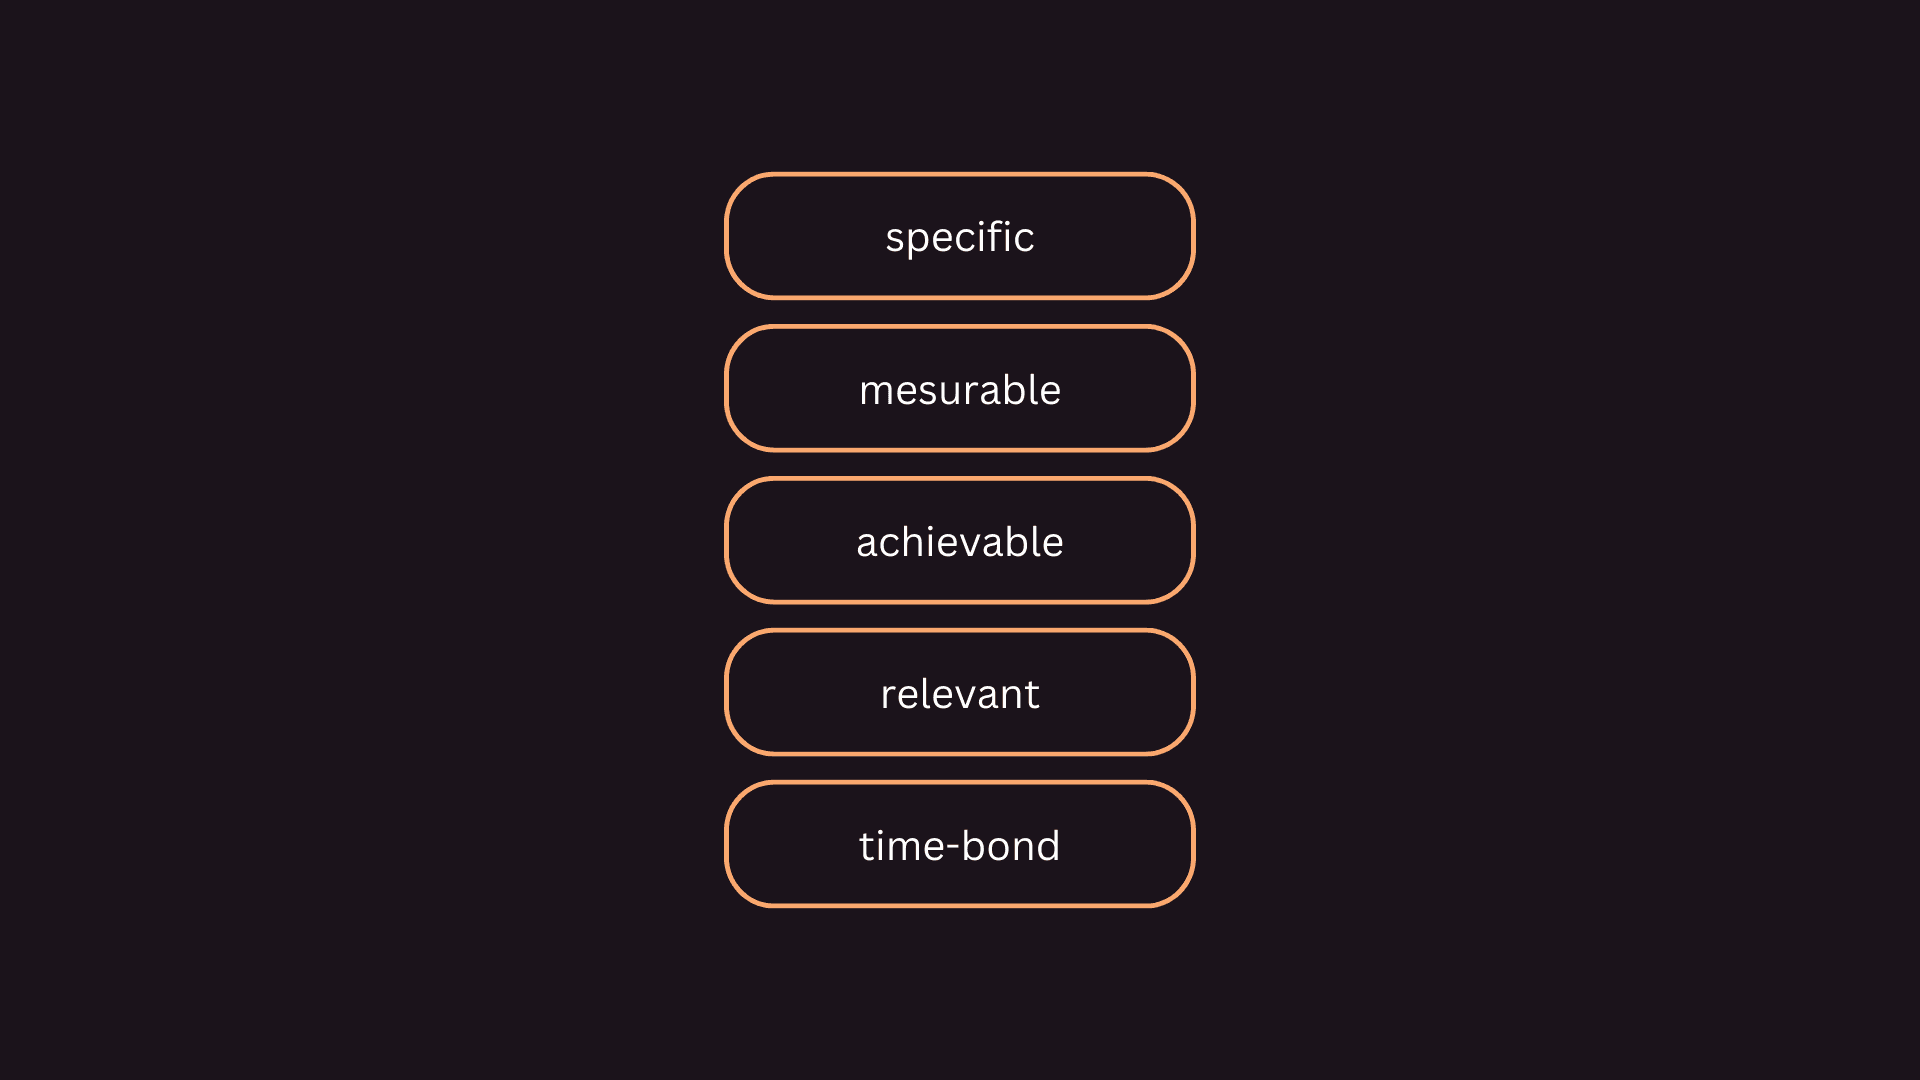
We followed the SMART criteria to ensure that the metrics would be specific, measurable, and achievable.


How did we define KPIs for UX?
How did we define KPIs for UX?
At this point, the focus was on behavioral metrics to capture the quality of interactions between users and the product.
Collaborating with product designers, we identified the product’s strategic features and the weak points in the UX. We tracked these points to gather data that would guide us in resolving outstanding issues.
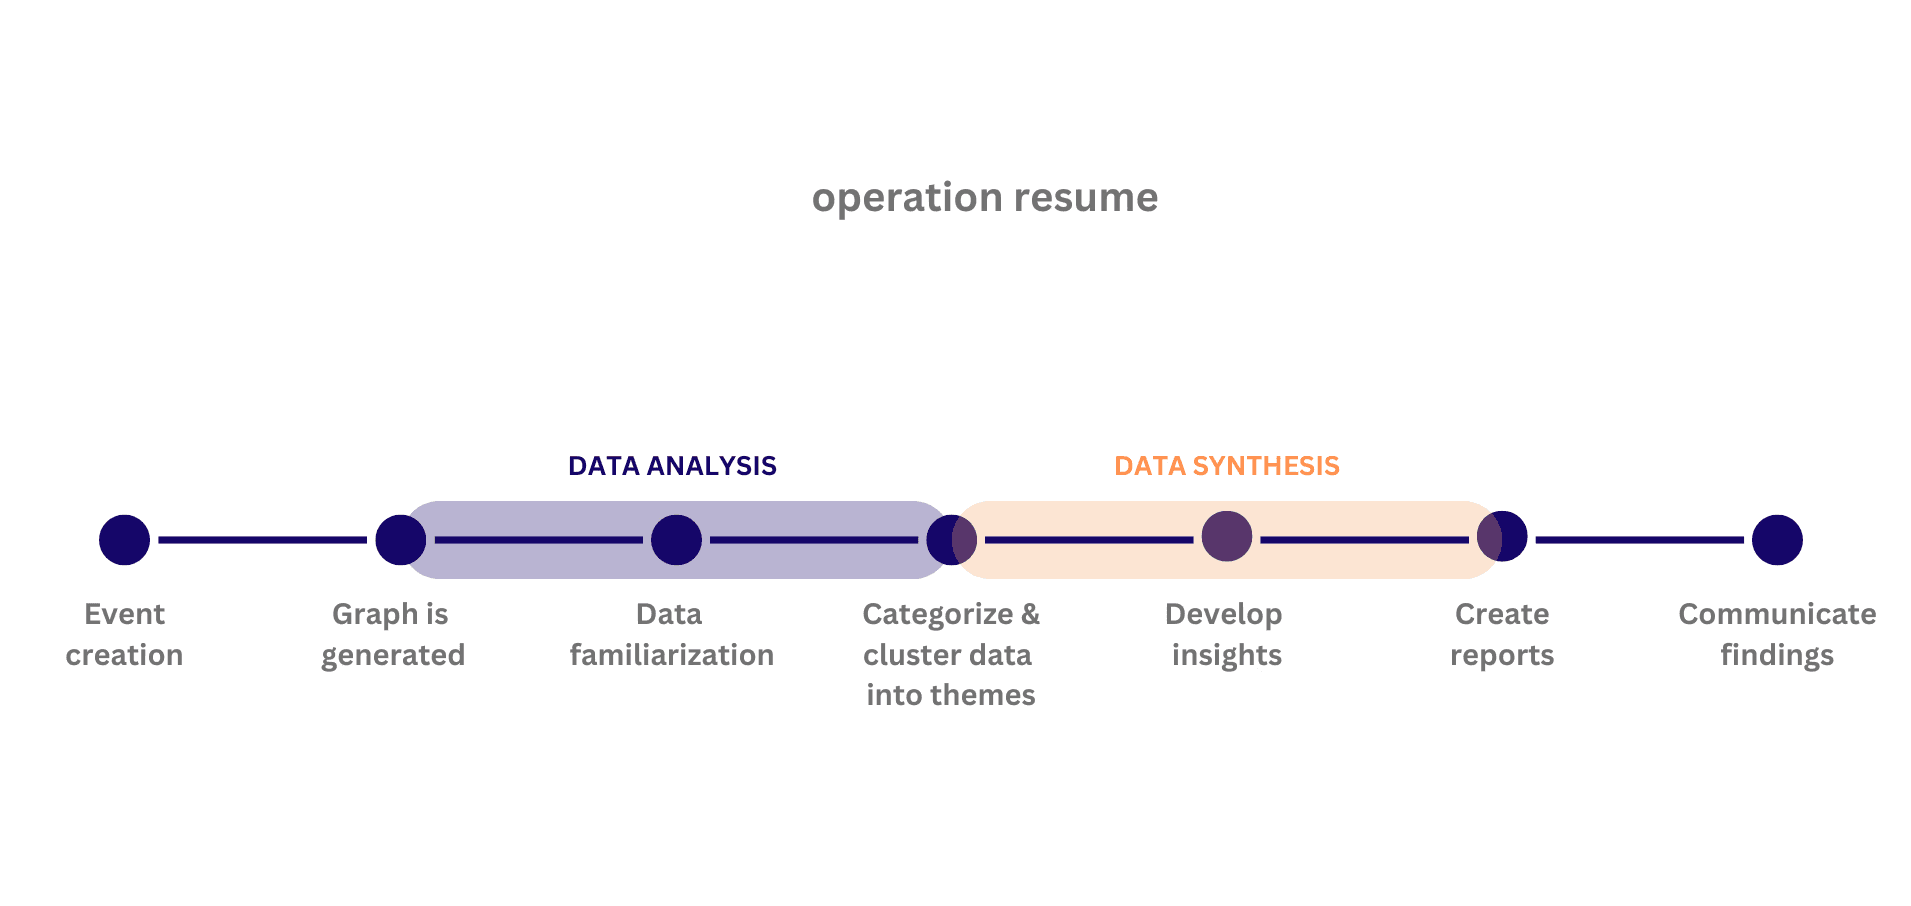
We also established specific analyses and monitoring processes, such as tracking user funnels and click patterns. These KPIs provided valuable insights that helped the UX team enhance the overall user experience.
How did we transition designers from designing experiences to measuring experiences?
How did we transition designers from designing experiences to measuring experiences?
This was a gradual process that was warmly embraced by designers who already recognized the potential of data to enrich project insights.
In essence, we initially bolstered our culture by showcasing how metrics could effectively enhance product UX. Subsequently, we provided comprehensive training on Mixpanel through a foundational course, equipping our team with practical skills to leverage data-driven insights effectively.


How did we help designers develop a critical eye towards data?
How did we help designers develop a critical eye towards data?
We fostered a culture of mentorship and engaged in regular discussions about data during daily stand-ups and insights meetings, encouraging designers to think critically.
Our focus was not just on measuring metrics, but on understanding how data insights could profoundly impact product development, emphasizing the importance of thoughtful analysis and strategic implementation.
How did the new event request process support designers and developers?
How did the new event request process support designers and developers?
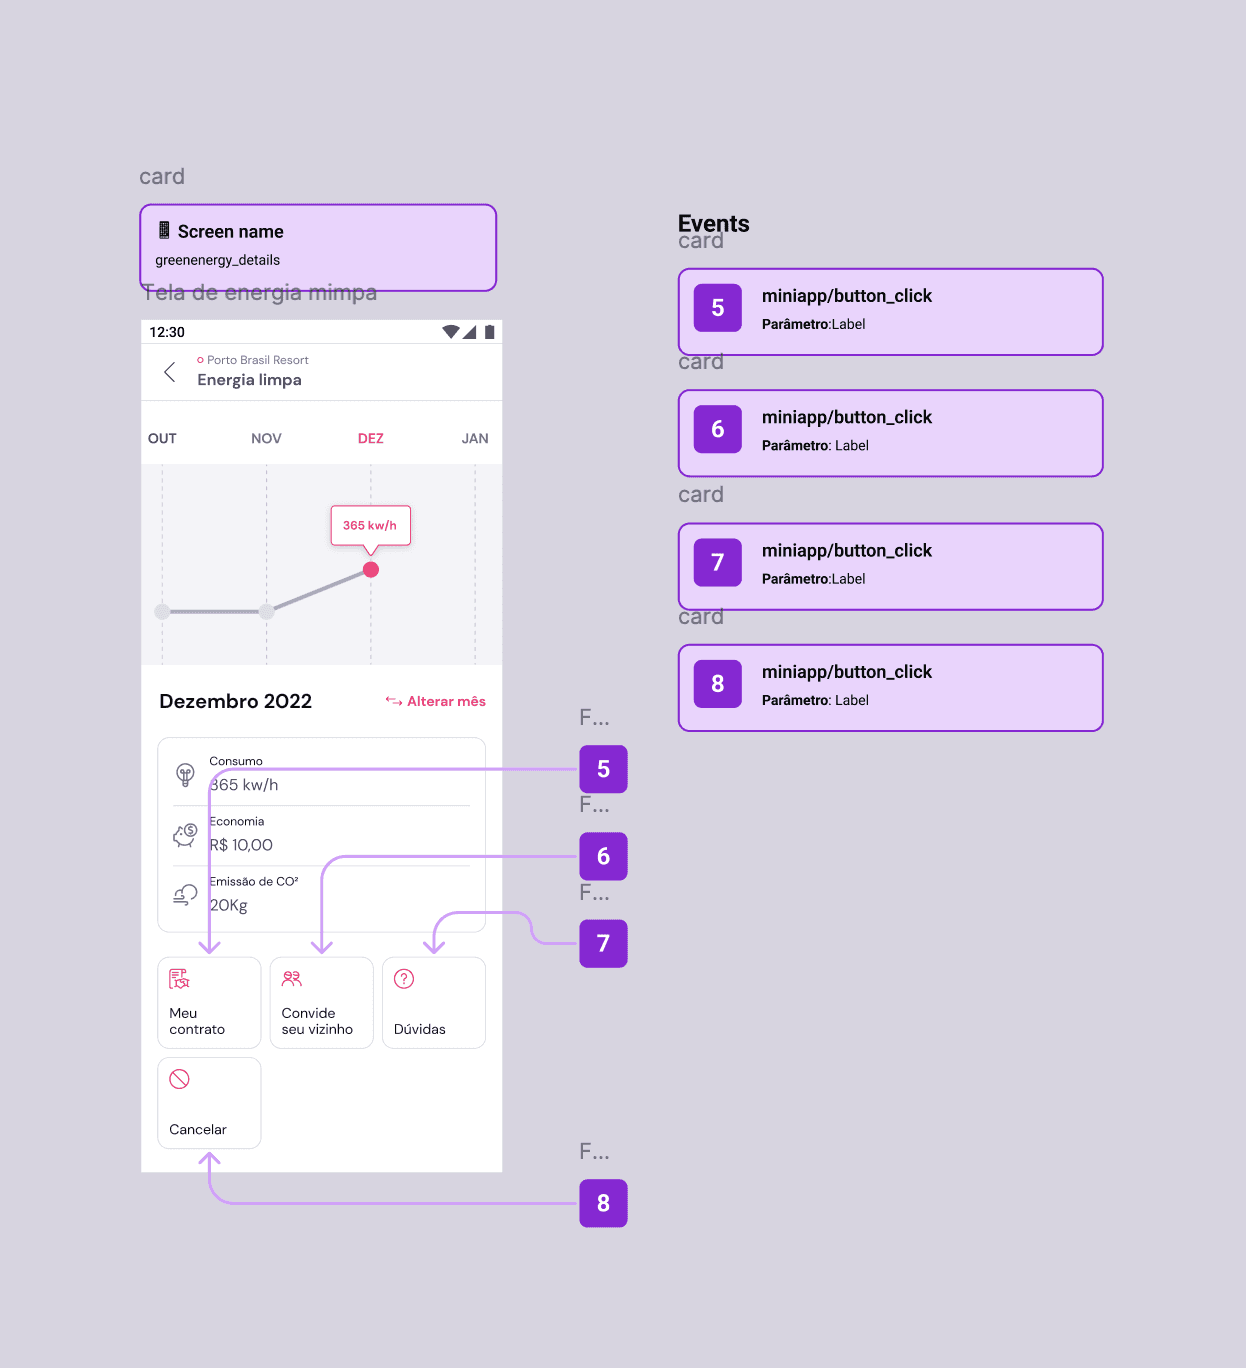
We streamlined collaboration between product designers and developers by implementing a visual documentation system in Figma. This system provides developers with access to final screens, technical specifications, development rules, and event requirements.
This ensures that each new feature launch incorporates all necessary events for accurate performance metrics, promoting seamless integration and alignment between design and development teams.


In retrospect
Applying data monitoring to a product from the outset was crucial for us to learn from our mistakes. Initially, we created global events and tracked everything, as it was a small app. As the app grew and evolved into a super app, we had to rethink our tracking strategy, focusing solely on key indicators and strategic features.
Today, the culture of data utilization at Gruvi is stronger than ever. Additionally, the documentation of key indicators and opportunities has been refined over the quarters to genuinely drive positive changes in the product.
Daily monitoring of NPS and store comments has also enabled us to swiftly identify issues and implement resolution strategies.
With this solidified culture, we are now working to generate more significant UX insights and opportunities within Gruvi.
In retrospect
In retrospect
Applying data monitoring to a product from the outset was crucial for us to learn from our mistakes. Initially, we created global events and tracked everything, as it was a small app. As the app grew and evolved into a super app, we had to rethink our tracking strategy, focusing solely on key indicators and strategic features.
Today, the culture of data utilization at Gruvi is stronger than ever. Additionally, the documentation of key indicators and opportunities has been refined over the quarters to genuinely drive positive changes in the product.
Daily monitoring of NPS and store comments has also enabled us to swiftly identify issues and implement resolution strategies.
With this solidified culture, we are now working to generate more significant UX insights and opportunities within Gruvi.